


The Interactive Map
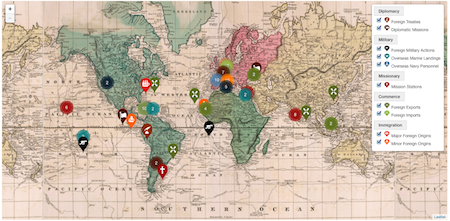
Click on the image above to summon an interactive digital world map using five historical maps and ten variables of historical data to trace activities of the United States around the world in the formative and transformative era between the American Revolution and the American Civil War. (Short instructions for using the digital map are below.)
What shall likely first catch the eye in watching the digital map flow through time is a dramatic expansion in the global reach of the United States. True enough, but the timeline and the many variables are meant to highlight the years of blood, sweat, and tears it took to conceive and enact this expansion.
The digital map features historical maps because American maps in the nineteenth century had to be continually revised to capture a world that seemed constantly to be changing: from the decolonization of the Spanish empire, to the exploration of the Pacific Ocean, to the territorial expansion of the United States itself. Many kinds of Americans embraced many kinds of opportunities to involve themselves in that changing world, until their multifarious activities would attain a thoroughly global scale by the late 1830s.
We might understand this outcome as one country’s “globalization” but it is imperative to appreciate the manifold purposes behind American activities in the world before they amounted to “globalization.” Globalization may be our simplistic term in the present, but it emerged out of many different goals and much strenuous effort in the past.
Short Version of Map Instructions
The first step is to position the digital map so that the full map, as well as the timeline slider at the bottom, fit on your screen. The larger the screen, the better.
At the top right of the map is a data menu where you can choose among the ten variables of historical data. You may choose one or more, and you may multiply or change your choices as you use the timeline slider.
Once you have initiated your choices, play the timeline slider, or click anywhere along it, to see the historical data appear on the map.
A number in a colored circle indicates that too much historical data overlaps one place. Clicking on the colored circle zooms in the map until you reach an icon in a colored circle, which denotes an individual data point.
Finally, clicking on an icon in a colored circle summons a data pop-up with textual explanation of the historical data represented on the map.
This interactive map has become the prototype for an ongoing digital history project. For more detailed instructions, and for some future directions in development for the digital map, see here.
 Globalization of the United States, 1789-1861 by Konstantin Dierks is licensed under a Creative Commons Attribution-NonCommercial-ShareAlike 4.0 International License.